
Box-Cox and Yeo-Johnson Transformations
Box-Cox and Yeo-Johnson TransformationsThe main motivations for transforming variables in data wrangling are to make data more suitable for analysis and modeling. Transformation often address specific challenges or requirements in the dataset, ensuring that it meets the assumptions of analytical methods or enhances interpretability and usability. In this post, we will discuss two common transformations: Box-Cox and Yeo-Johnson. Both transformations are used to transform skewed data to make it...
GDPR
General Data Protection RegulationGDPRThe General Data Protection Regulation(GDPR) is a comprehensive data protection law enacted by the European Union to enhance individuals’ control over their personal data to harmonise data protection rules across EU member states. GDPR was introduced in response to rapid technological developments and the increasing scale of personal data processing in the digital economy. GDPR emphasises the protection of individuals’ fundamental rights and freedoms, par...
Dimensionality Reduction and PCA
Dimensionality Reduction and PCADimensionality Reduction: A Comparative Review Dimensionality reduction is not just a technical trick. It’s a way of seeing data more clearly, almost like finding the right angle to view a complex sculpture. By reducing dimensions, we reveal the “shape” of the data—clusters, patterns, and relationships that would otherwise be hidden. Principal component analysis (PCA) is a fancy name for the whole process of reflecting upon what happens along the projections on...
Data Matching
Data MatchingData Matching After reading `Data Matching: Concepts and Techniques for Record Linkage, Entity Resolution, and Duplicate Detection, I gained a clearer understanding of the challenges involved in working with real-world data. The book highlights that data is often incomplete, inconsistent, and noisy, and that data matching aims to identity records referring to the same real-world entity under these imperfect conditions. Rather than focusing on a single algorithm, the book presents...
Imbalanced Data
Imbalanced DataImbalanced data research The editorial on Learning from Imbalanced Data highlights the central challenge that in many real-world applications—such as fraud detection, medical diagnosis, and anomaly detection—the important class is often rare, causing standard machine-learning algorithms to bias heavily toward the majority class. It summarizes three major research directions: data-level methods (oversampling, undersampling, synthetic sample generation), algorithm-level methods (...
Outlier
Outliers123456import numpy as npimport pandas as pdimport matplotlib.pyplot as pltimport seaborn as snspd.set_option("display.notebook_repr_html", False) # disable "rich" outputplt.style.use("seaborn") Unidimensional Data1234567x = np.loadtxt("https://raw.githubusercontent.com/gagolews/" + "teaching-data/master/marek/blobs2.txt")plt.subplot(121)sns.boxplot(data=x, orient="h")plt.subplot(122)sns.histplot(x, binwidth=1)plt.show() M...
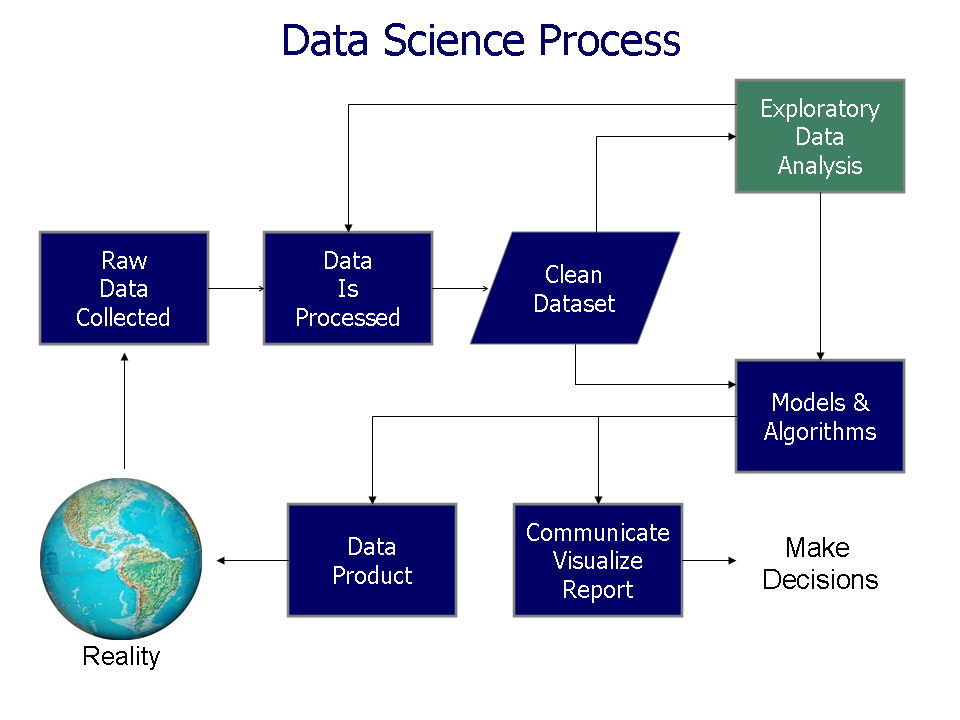
Exploratory Data Analysis
Exploratory Data AnalysisEDA%20is,step%20in%20any%20data%20analysis.) Exploratory Data Analysis(EDA) is the process of looking at data before doing any detailed analysis. Its goal is to understand what the data looks like, find mistakes or unusual values, and discover simple patterns. In EDA, we check how individual variables are distributed, see whether two variables seem related, and identify outliers that may need attention. This is often done using simple charts and basic statistics. EDA ...
Continuous Probability Distributions
Continuous Probability Distributions1234import numpy as npimport matplotlib.pyplot as pltimport seaborn as snsplt.style.use("seaborn") 123456heights = np.loadtxt("https://raw.githubusercontent.com/gagolews/" + "teaching-data/master/marek/nhanes_adult_female_height_2020.txt")sns.histplot(heights, stat="density", kde=True)plt.show()import scipy.stats Normal DistributionNormal Distribution12345678μ = np.mean(heights) # an estimator of expected valueσ =...
Multivariate Categorical and Relational Data
Multivariate Categorical and Relational Data12345import numpy as npmarathon = np.loadtxt("https://raw.githubusercontent.com/gagolews/" + "teaching-data/master/marek/37_pzu_warsaw_marathon_3groups_top1000.txt", delimiter=",", dtype=str)marathon[:6, :] # preview Two-Way Contingency Tables123np.unique(marathon[:, 0])np.unique(marathon[:, 1]) 123456import scipy.statsl, v = scipy.stats.contingency.crosstab(marathon[:, 0], marathon[:, 1])l, vimport marekmarek.pr...
Visualising Multidimensional Data and Measuring Correlation
Visualising Multidimensional Data and Measuring Correlation123456789import numpy as npimport pandas as pdbody = pd.read_csv("https://raw.githubusercontent.com/gagolews/" + "teaching-data/master/marek/nhanes_adult_female_bmx_2020.csv", comment="#")body = body.to_numpy() # data frames will be covered laterbody.shapebody[:6, :] # 6 first rows, all columns Scatterplots2D Data1234567891011import matplotlib.pyplot as pltimport seaborn as snsplt.style.use("...